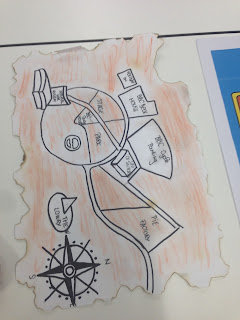
The task here was to review the second maps and compare with each other to see what reflection and thoughts we have incorporated in the map.
The following photos were students' maps.
The production of creativity has incorporated with the map. I like how it formed as an old motion picture film that gave the audiences an atmosphere of reminiscence and dramatically emotions. The 'making of ' of this map was that designer took the photos of his key moment and then made them as a form of motion film picture.
I like the layout of this map as it presented content in a way that guides viewers through identifiable landmarks of the media city. There is a girl travel from and it seems a photos album rather than a map. In addition to the layout, I can see the personality of the designer. She used digital painting to visualised her memory.
This map was very interesting, it was a 3D paper craft that presented the lecture moment. It has effectively visualised her key moments such as several students sat there with a coffee on the table, their expression tells viewers that they were concentrating to the speech... This is a good idea to compelling story as viewers would be attracted by the 3D object and spend more time to read it.
The illustration and iconography were two main visual communication elements in this map. I can see the symbol of "M" which clearly indicated the media city, this was simple and easy to understand and universal. They enhanced comprehension and does not make viewers feel distracted at all.
Typography, colours and iconography had been incorporated on this map. It was outstanding and highlighted the important information for viewers. I can clearly see the route and the landmarks that contain the Quays, bridge and Imperial War Museum.
The photo above was my own map. This time I've incorporated several techniques such as colours, iconography and simplicity to visualise my journey for audiences. I used colour to represent each landmark. For example, I chose red to indicate The University of Salford, green to express the garden, yellow and orange to symbolised the tram and grey to imply the Imperial War Museum. I believed that colours can easily demonstrate the meaning and communicate with audiences.
In addition to colours, the iconography also enhanced viewer's comprehension as all the shapes were drawn according to realities. A good example of iconography can be The Imperial War Museum, I draw it as a shell because the building was slightly curved and unique.
In conclusion, the task has made me slightly understand the connection between the map and 'making of'. We considered our A and B, we took the photos of landmarks, We attempted to use different methods to visualise our journey...
We drew it, digitised it, and even made it into 3D models... This has made me understand that visual communication is not limited on sketches, it can be divergently and changeability.
In addition to the divergent methodologies, the task also incorporated a number of techniques such as colours, layout, iconography... They helped us to highlight the important information, to maintain consistency, and to enhance comprehension.
The map was the reflection of our memories, the 'making of' of this map wasn't easy, we documented everything include other's works, observe and analysis someone else's' maps in order to enhance our own development. From this task, I've gained a lot of visual communication skills and become a better storyteller. I will make sure I apply these knowledge into my future project and become an effective storyteller.


No comments:
Post a Comment